HPE Ezmeral Data Fabric Monitoring Architecture
HPE Ezmeral Data Fabric Monitoring integrates with open-source components to collect, aggregate, store, and visualize metrics and logs.
NOTE
The HPE Ezmeral Data Fabric Monitoring architecture is designed for use on HPE Ezmeral Data Fabric cluster nodes.
Installing monitoring components on client nodes or edge nodes is not
supported.Metric Monitoring Architecture
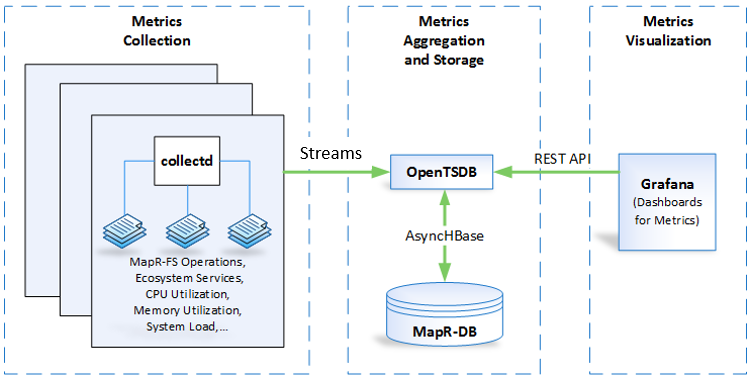
To visualize cluster metrics, HPE Ezmeral Data Fabric Monitoring integrates with the following components:

- collectd
- The collectd service runs on each node in the cluster to collect metrics. It uses streams to send the metrics to opentsdb. For more information, see Metric Collection.
- OpenTSDB
- OpenTSDB aggregates the metrics and runs as the time-series database on top of HPE Ezmeral Data Fabric Database, the metrics data store. Based on your cluster requirements, it runs on one or more nodes in the cluster.
- Grafana
- Grafana uses REST API to access metrics data from OpenTSDB. Using a single instance of Grafana, users can build custom dashboards or use sample dashboards to visualize the metric. For more information about dashboards, see Metric Visualization.
Log Monitoring Architecture
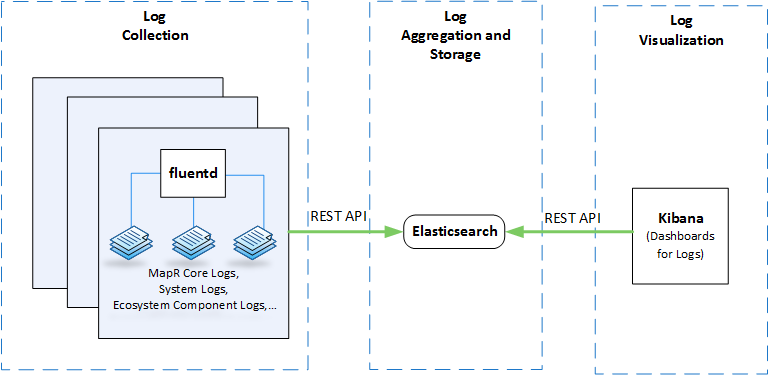
To visualize logs, Data Fabric Monitoring integrates with the following components:

- fluentd
- fluentd runs on each node in the cluster to collect and parse logs. It uses REST API to send the logs to ElasticSearch. For more information, see Log Collection.
- Elasticsearch
- Elasticsearch indexes the logs so that they are easily accessed and searchable. Based on your cluster requirements, it runs on one or more nodes in the cluster. For more information, see Log Aggregation and Storage.
- Kibana
- Kibana uses REST API to access and search the logs available in Elasticsearch. Using a single instance of Kibana, users can create visualizations and dashboards to analyze their logs. For more information, see Log Visualization.