Dashboard - Platform Administrator
The Platform Administrator Dashboard screen by either selecting Dashboard in the main menu. The Platform Administrator Dashboard screen presents a high-level overview of current activity. (See Dashboard - Kubernetes Administrator for information about the Kubernetes dashboard.)
The top of this screen contains the Refresh Data function, which displays the date and time of the most recent Dashboard refresh. Clicking the Refresh Data button refreshes the data on this screen.
The following tabs are available:
- Usage: This tab displays usage information on a per-tenant basis. See Usage Tab.
- Load: This tab displays load statistics for on-premises CPU, memory, and network resources. See Load Tab.
- Services: This section displays the health status for each component service for each host. See Services Tab.
- Alerts: This tab displays any alert messages generated by the system. See Alerts Tab.
Usage Tab
The Usage tab displays usage statistics for the Big Data tenants and AI/ML projects.
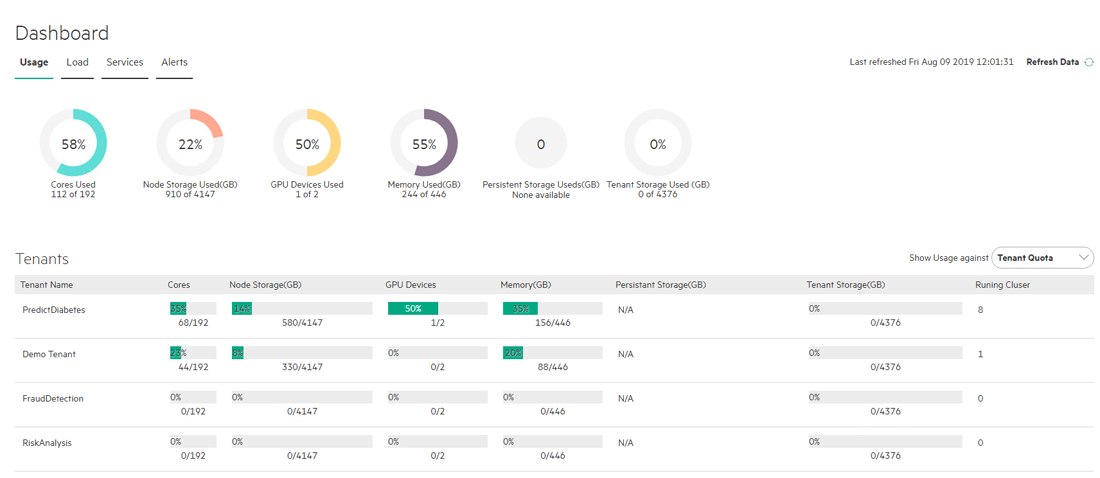
The top of the Usage tab displays dials showing the following aggregate information for all of the tenants/projects:
- Cores Used: Percentage of available virtual CPU cores being used by all of the tenants.
- Node Storage Used (GB): Percentage of available node storage being used by all of the nodes.
- GPU Devices Used: Number of GPU devices being used and the total number of GPUs, if any. This only appears if the deployment is running RHEL/CentOS 7.x.
- Memory Used (GB): Percentage of available RAM being used by all of the tenants.
- Persistent Used (GB): Percentage of available persistent storage used and the total available persistent storage, in GB.
- Tenant Storage Used (GB): Percentage of available tenant storage being used by all of the tenants.
The bottom of this tab contains a table that lists all of the tenants and projects.
This table displays the Tenant Name, Cores Used, Node Storage Used
(GB), GPUs Used, Memory Used (GB), Persistent Used
(GB), Tenant Storage Used (GB), and the number of Running
Clusters being used by that tenant. This number is expressed as x of y, where x is the allotted number and y is
either the Tenant Quota or total System Resources, depending on your Show Usage
against menu selection.
Load Tab
The Load tab displays a series of dials and charts. Hovering the mouse over a bar opens a popup with more detailed information for the selected time.
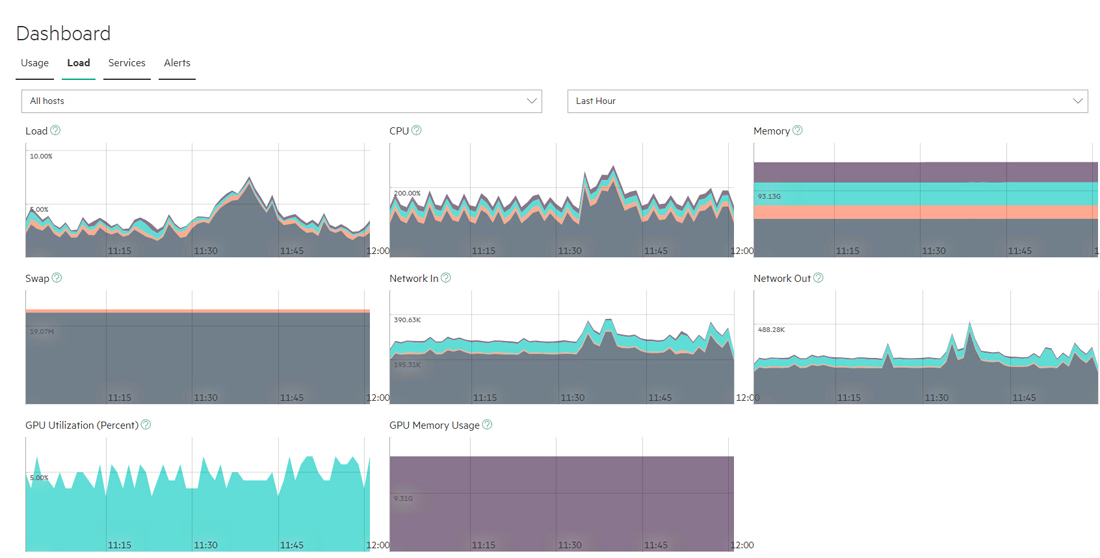
This tab shows the following information for the selected time period:
- Load: One-minute average system load percentage for the selected host(s) over the selected time period.
- CPU: Percentage of host CPU utilization across all user space processes that are currently running for the selected host(s) over the selected time period. On multi-core systems, the percentages can be greater than 100%.
- Memory: Current use of host memory across all cluster processes for the selected host(s) over the selected time period.
- Swap: Amount of swap-file usage over the selected time period for the selected host(s) over the selected time period, in GB.
- Network In: Amount of incoming host network bandwidth being used by the selected host(s) over the selected time period.
- Network Out: Amount of outgoing host network bandwidth being used by the selected host(s) over the selected time period.
The following additional information applies to tenants with GPUs enabled:
- GPU Utilization (percent): Selecting All hosts in the left pull-down menu displays aggregate GPU utilization in percent per host. Selecting an individual host displays per-GPU utilization for that host.
- GPU Memory Usage: Selecting All hosts in the left pull-down menu displays aggregate GPU memory usage in percent per host. Selecting an individual host displays per-GPU memory usage for that host.
You may select the host(s) you want to view and also adjust the time period for which results appear using the pull-down menus at the right side of the Load tab. The available options are:
- Last Hour (default)
- 6 Hours
- Day
- Week
Services Tab
The Services tab displays the status of services for each host being used for Big Data tenants and/or AI/ML projects.
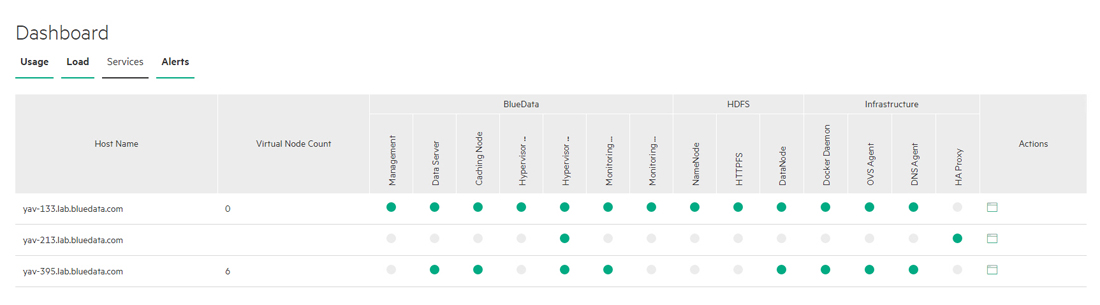
This tab displays information such as (but not necessarily limited to) the following for each BD/AI/ML host:
- Host Name: Name of the host.
- Virtual Node Count: Number of virtual nodes running on that host.
- BlueData: This group displays the following information:
- Management: Status of the management service, which handles back-end administration tasks.
- Data Server: Status of the data service agent, which acts as an intermediary between the file system and other entities. This service establishes communication between a host's virtual nodes and the Caching Node service. On the Controller host, the Data Server also receives DataTap browsing queries from the Management Service.
- Caching Node: Status of the data service, which communicates with the storage services referenced by DataTaps. This service provides an accelerated I/O channel between those storage services and the applications running in virtual nodes. On the Controller host, this service also provides the back end for DataTap browsing.
- Hypervisor Controller: Status of the hypervisor controller, which manages virtual nodes (containers) along with the Hypervisor Agent service.
- Hypervisor Agent: Status of the hypervisor agent, which manages virtual nodes (containers) along with the Hypervisor Controller service.
- Monitoring Collector: Status of the monitoring engine that collects performance, usage, and other metrics.
- Monitoring Database: Status of the database that stores monitoring information.
- HA: This group only appears if High Availability is enabled. When
enabled, this group displays the following information:
- HA Engine: Health of the High Availability Engine, which is the central High Availability state transitions executing unit. The HA Engine performs various tasks specific to High Availability in response to requests from other services and must be running on both the Controller and Shadow Controller hosts.
- HA Status: Status of the High Availability service. The node for which this service appears is functioning as the Controller host. If this dot is green, then the High Availability host is functioning normally and all hosts (Controller, Shadow Controller, and Arbiter) are up. This dot appears as yellow if one of these three hosts has failed to indicate that the High Availability cluster has been degraded and that the deployment is not protected against any further host failure. If the dot is red, then High Availability protection is not currently functional.
- Pacemaker: Health of the High Availability cluster polling service. This service periodically polls the High Availability cluster and, in the event of a failure, triggers failover state transition in the HA Engine. This service must be running on both the Controller and Shadow Controller hosts.
- Cluster Management: Health of the cluster manager daemon that helps the Pacemaker service perform its periodic polling and trigger failover/failback. This daemon must be running on both the Controller and Shadow Controller hosts.
- Infrastructure: Describing the individual items in this group is beyond the scope of this manual. This group includes the HA Proxy service. This is the service that runs on Gateway host(s). If this service is down, then end users will not be able to access virtual cluster service endpoints.
- Actions: The Actions column of the table includes a Check Now icon (folder) for each host. Clicking this icon refreshes the status of all listed services for the selected host.
The status of a service can be either OK (green dot), CRITICAL (red dot), or DISABLED (intentionally not running; gray dot). Hovering the mouse over the status button opens a popup with additional information. In general:
- The Controller host must not display any red dots. If the Controller host has one or more error(s), then HPE Ezmeral Runtime Enterprise may not function properly.
- If all of the dots for a Worker host are red, then that host will not be able to provide resources. This situation typically occurs because the host has been powered off, has lost network connectivity, or because HPE Ezmeral Runtime Enterprise is not properly installed.
- A Worker host with some red and some green dots may cause some operations to fail, unless the errors are transient conditions caused by the host powering on or regaining network connectivity.
Please generate a support bundle and then contact Hewlett Packard Enterprise Technical Support if a host that is reporting service errors meets all of the following criteria:
- HPE Ezmeral Runtime Enterprise is completely installed.
- The host is powered on.
- The host has network connectivity.
See The Support/Troubleshooting Screen and Generating a Support Bundle.
Alerts Tab
The Alerts tab displays any alert messages from the Caching Node, Data Server, and Management services.
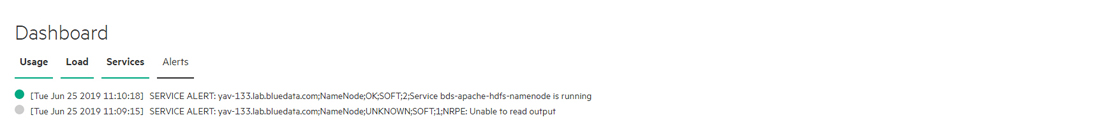
The following alerts appear in this tab:
- Notifications: Routine messages. A green dot appears next to each routine notification.
- Error: A minor error has occurred. A gray dot appears next to each error notification.
- Warning: A serious error has occurred. An orange dot appears next to each warning notification.
- Critical: A critical error has occurred. A red dot appears next to each critical notification.