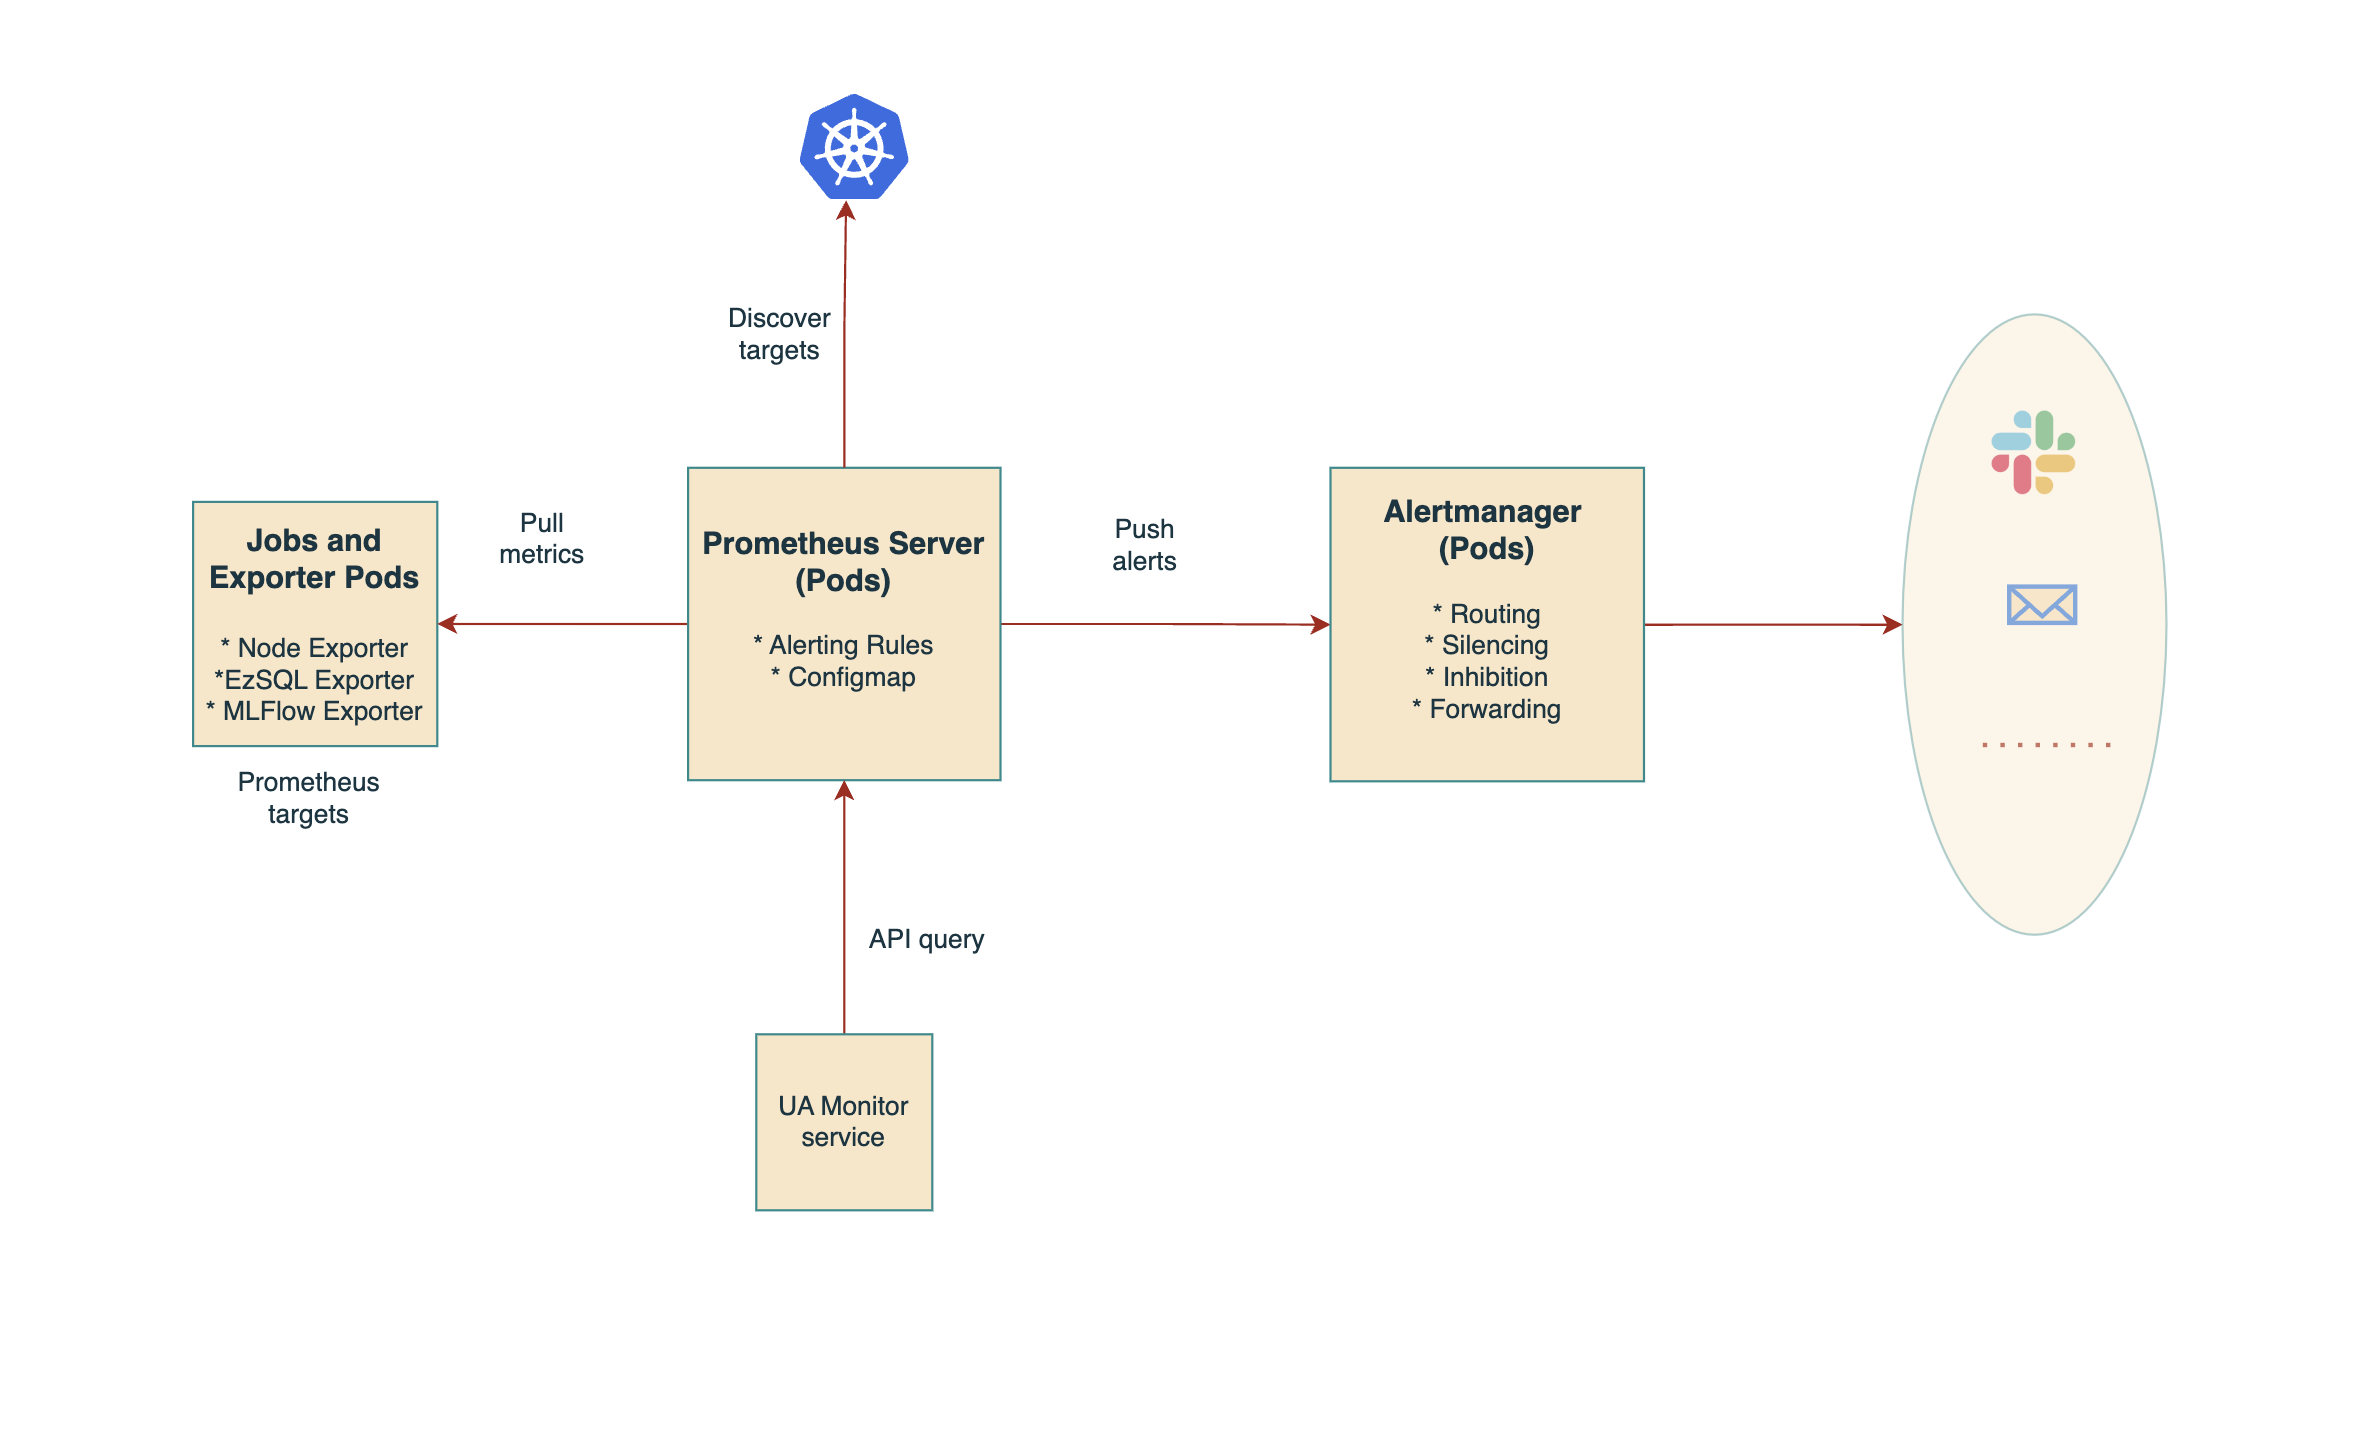
Alerting Architecture and Components
Shows the alerting architecture diagram and describes the alerting components included in HPE Ezmeral Unified Analytics Software.

- Prometheus
-
Prometheus is an open-source monitoring and alerting system that specializes in collection of the time-series data.
Pull-based monitoring: Prometheus actively scrapes metrics from the configured targets at regular intervals using pull-based monitoring.
PromQL: Prometheus uses the powerful query language called PromQL for data analysis and defining the alert rules. For example: The following alert rules send notifications if there are more than 100 HTTP requests with 500 status code on the API server at a specific time.http_requests_total{job="api_server", status_code="500"} > 100 - Alertmanager
-
Alertmanager uses the metrics data and labels generated by Prometheus to enrich notifications with relevant information.
Alert routing: Alertmanager routes notifications to different communication channels such as email, Slack, webhooks, and others. For example, you can configure the routing rules to route the critical alerts to PagerDuty for immediate action and route all other alerts with low priority to a Slack channel.
Deduplication and grouping: Alertmanager groups alerts to reduce noise, resulting in an organized presentation of issues. For example, multiple alerts about high disk usage on different servers within a cluster are grouped as a single alert.
Silencing and inhibition: Alertmanager suppresses alerts for a certain time. For example, you can silence alerts during the planned maintenance period. You can also inhibit alerts based on dependencies such as not sending out alerts on database issues when the primary network is down.
- Exporters
-
Exporters are specialized software that exposes metrics from different systems and applications in a format Prometheus can understand.
Node Exporter: Exposes hardware and operating system metrics such as CPU, memory, disk, and network.
Mysqld Exporter: Exposes metrics from MySQL databases such as queries per second, connections, and replication status.
Kubernetes Exporter: Exposes metrics from a Kubernetes cluster.