Describes how to enable metrics in the Ray dashboard.
Prerequisites
- Ensure that Ray's head pod has enough resources to run the Grafana server.
-
By default, the Ray head node is adequately provisioned for Grafana.
However, resource needs vary based on the intensity of Ray job
submissions. Although the head node does not directly run jobs,
large file submissions can strain object memory.
Therefore, the adequacy of resources depends on the specific case.
You must monitor performance and adjust resources to find the
optimal balance for your specific use case.
To find the minimum resource requirements for Grafana, see Grafana minimum system
resources.
- To configure the Ray resources, see Configuring Resources in the UI.
About this task
To enable Metrics view in dashboard, you must install Grafana, configure the data
source as centralized Prometheus, and start the Grafana server with the specific
configuration file in Ray's head pod.
Procedure
-
By default, Ray’s metrics are scraped by centralized Prometheus, so specify
Prometheus’ service URL as the data source in
/tmp/ray/session_latest/metrics/grafana/provisioning/datasources/default.yml
file.
For example:
apiVersion: 1

datasources:
  - name: Prometheus
    url: http://af-prometheus-kube-prometh-prometheus.prometheus.svc.cluster.local:9090
    type: prometheus
    isDefault: true
    access: proxy
-
Install Grafana in Ray's head pod and navigate to Grafana's home
directory.
To install Grafana in Ray’s head pod, follow these steps:
-
Access the shell on the head node.
kubectl -n kuberay exec -it <head_pod_name> -- bash
-
Download Grafana.
wget https://dl.grafana.com/oss/release/grafana-9.3.6.linux-amd64.tar.gz
-
Go to the Grafana home directory.
tar -zxvf grafana-9.3.6.linux-amd64.tar.gz
cd grafana-9.3.6
-
Start the Grafana server with the Ray configuration file.
./bin/grafana-server --config /tmp/ray/session_latest/metrics/grafana/grafana.ini web
-
Forward Grafana's default port.
kubectl -n kuberay port-forward --address 0.0.0.0 <head_pod_name> 3000:3000
-
Click the Tools & Frameworks icon on the left
navigation bar. Navigate to the Ray tile under the
Data Science tab and click
Open.
Results
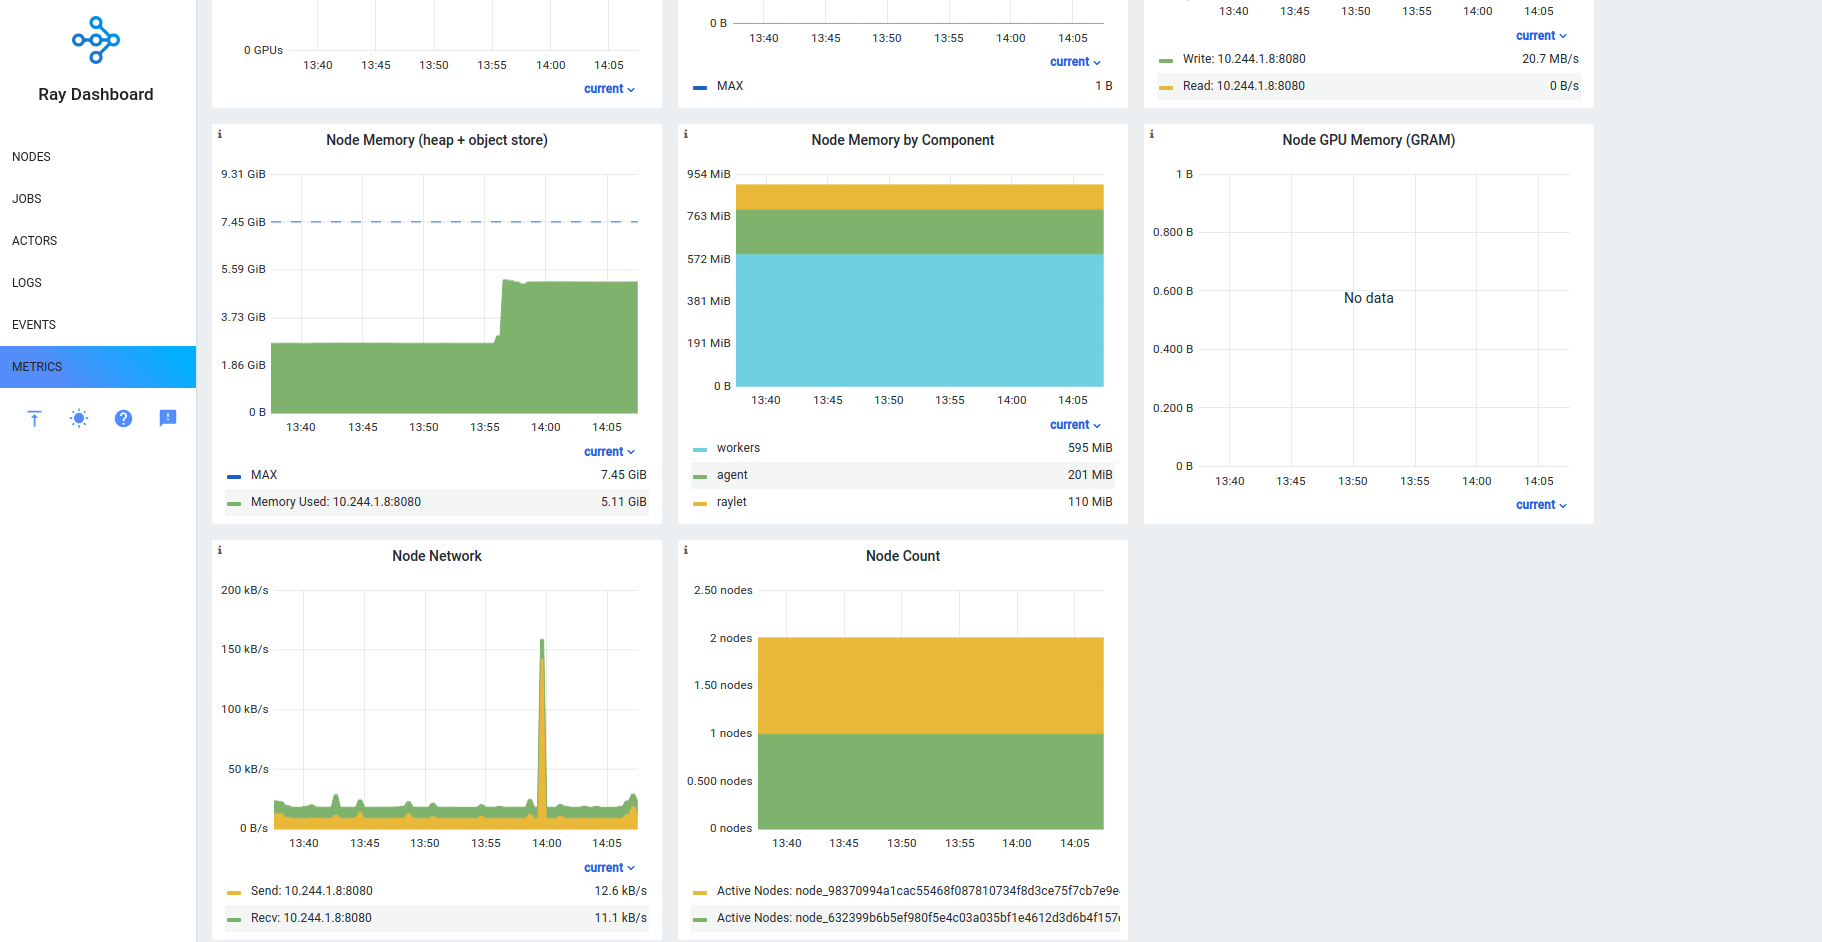
Metrics view is enabled in the Ray dashboard.
To learn more, see Ray Metrics.