Managing HPE Ezmeral Data Fabric on Kubernetes
This article describes managing and accessing the Data Fabric cluster and tenants.
Managing Using the CLIs
You can interact with the Data Fabric cluster via
the Command Line Interface (CLI) pods (such as admincli-0) created
in the cluster namespace. You can directly access individual pods (such as CLDB),
but best practice is to only do this when needed to debug an issue. In the
Kubernetes environment:
- You can access pods via either the
kubectl execcommand or via SSH, as described in SSH. - Pods are ephemeral. Any state created in a pod might disappear.
- There are two main types of administration pods:
- The admin CLI pod in the Data Fabric cluster namespace.
- Tenant CLI pods in the individual tenant namespaces.
Admin CLI Pod
This pod is suitable for runningmaprcli commands commands and data-loading scripts (link opens in a new
browser tab/window).HPE Ezmeral Data Fabric Cluster
Administrators should access the admin CLI (admincli-0) pod in the
dataplatform namespace.
For example, you can access the admin CLI pod by using kubectl in
the Kubernetes Web Terminal:
- Get the value of the
namespace:
kubectl get pods -A | grep -e admincli-0 -e NAMESPACEThe value of the namespace is returned.
- The default name of the admin CLI pod is
adminicli-0. Access the admin CLI pod using akubectl execcommand:kubectl exec -it admincli-0 -n <namespace> -- /bin/bash
Tenant CLI Pod
Kubernetes Tenant Member users can generate tickets or start Spark jobs via the tenant CLI Terminal pod provided in most tenant namespaces. Kubernetes Tenant Administrator users can use the tenant CR to disable this pod.
Accessing the Data Fabric Cluster
There are several ways to access the Data Fabric cluster, filesystem, and other installed components:
HPE Ezmeral Data Fabric Control System
You can access the HPE Ezmeral Data Fabric Control System (MCS) in your internal environment by clicking the Data Fabric Managed Control System link for the Data Fabric cluster in the Kubernetes Clusters screen.
SSH
You can use SSH to log in to a container and gather information. By default, all containers come up with SSH running.
- Internal SSH Access: SSH is available to Port 22 in every Data Fabric cluster container. Within a cluster, you can SSH from one container to another without specifying a port.
-
External SSH Access: You must provide the
sshportandhostnameto access a container from outside the cluster. If thesshportis already defined, you can find that port in the CR for the container. You can understand with following example.Following example is for grafana service:- To find the port number, use the following command:
kubectl get services -n mycluster | grep -i grafanaExample of the result:
The number after the colon is the port number. In this case, 31755 is the port number forgrafana-svc NodePort 10.111.102.36 <none> 3000:31755/TCPgrafanaservice. - To access the service:
- Access the login page, using the following URL format:
https://<ip address of cluster node>:31755 - On the login page, enter the username and password.
For information about how to get the username and password for the mapr user, see Data Fabric Cluster Administrator Username and Password.
- Access the login page, using the following URL format:
NOTEThe preceding example is for grafana service. The same procedure can be applied to other services, such as Kibana. To find the port number for any service, enter that service in <sevice name> in the following command:kubectl get services -n mycluster | grep -i <service name>To find the list of container services available, execute the following command:kubectl get services -n mycluster - To find the port number, use the following command:
To determine the hostname for a container, execute the kubectl get
pod command. For example:
kubectl get pod -n mycluster cldb-0 -o wide
NAME    READY    STATUS     RESTARTS    AGE      IP             NODE
cldb-0  1/1      Running    0           3h32m    10.192.2.10    dev.01.lab
To log in using SSH, specify the external port, your user name, and the host name. For example:
ssh -p 5000 userj@dev.01.labComparing EXEC vs. SSH Access
The kubectl exec command is the easiest way to access a container,
however this access occurs as the user the container runs as (typically mapr). This access is useful for Administrators but may include
permissions unsuited to non-admin users. You may want to restrict container access
to SSH, which only grants users the privileges granted to their current user
accounts.
API
The following APIs grant access to the installed components (link opens in a new browser tab/window):
POSIX Client
You can access the Data Fabric cluster using the
POSIX Client via the CSI
driver. The CSI driver reports the Kubernetes worker node where the POSIX client is
scheduled to run as the POSIX client host. The StorageClass should specify either
the IP address of the MCS pod or the webserver service. For
example:
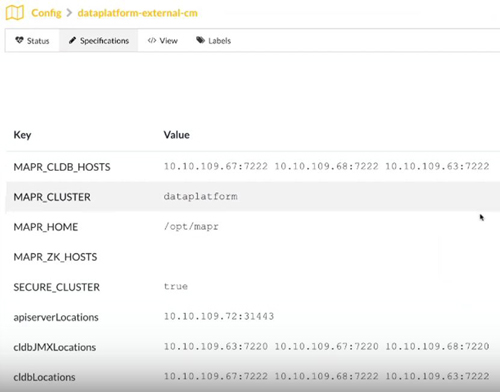
mcs-svc.<clustername>.svc.cluster.localExternal Access to Services
The CLDB object and most services are accessible outside of the cluster, and some
include open host ports. You can connect to the corresponding pods without having to
run as a pod inside the cluster. In the namespace
hpe-externalclusterinfo, the
<data-fabric-cluster-name>-external-cm configmap provides
information about how to access these services from outside the cluster:
The Data Fabric-hivesite-cm Hivesite configmap, shows the Hivesite
information that is available external to the cluster.
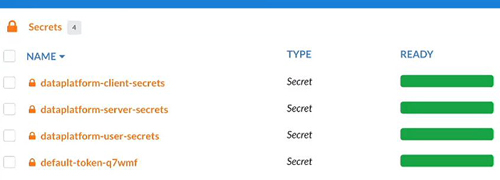
hpe-externalclusterinfo also provides the secrets needed to
connect to the cluster from an external compute tenant that doesn't exist inside the
cluster:
Logging and Coredump Directory Structure
The following logs are available:
- The physical Kubernetes node hosting the pod includes component logs.
- Data Fabric logs (link opens in a new browser tab or window).
All Data Fabric pods share a parent logging directory path on the node. This path can be configured in the Data Fabric CR. For example:
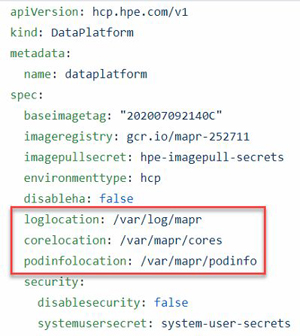
The platform creates logs in this directory that correspond to each pod under this directory and follow a predefined directory structure. The pods themselves are ephemeral, but all logging directories persist on the physical nodes and can be retrieved later.
The LOGLOCATION , CORELOCATION , and
PODLOCATION directories cannot be nested, because this
could cause a mount issue. For example, the corelocation directory cannot be
nested under either of the other two directories.
Log Format
Logs follow this general format:
/UserSpecifiedParentDir/ClusterName/ClusterCreationTime/PodTypeName/PodNameFor example, a CLDB pod log might look like this:
/var/log/mapr/mycluster/20200802174844/cldb/cldb-0The log components are:
/UserSpecifiedParentDir- Data Fabric CR property. Default is/var/log/mapr/. Hewlett Packard Enterprise recommends keeping the partition that contains<UserSpecifiedParentDir>separate from the partition that contains/var, to prevent filling the/varpartition and risking OS stability/crashes./ClusterName- Cluster or namespace name./ClusterCreationTime- Time a specific cluster instance was created. This identifier is used because a cluster name can have multiple lifecycles and different cluster instances can share the cluster name./PodTypeName- Pod type, such ascldbormfs./PodName- Pod name.
The /opt/mapr/cluster_logs directory is volume-mounted to the
UserSpecifiedParentDir on the node. This directory is the
starting point for all logs on the corresponding physical node. When created, each
pod creates its own logging directory following the above rule based on the
UserSpecifiedParentDir. This per-pod approach ensures that the
same directory won't be recreated if it already exists. Stateful pods that do not
change nodes between failures (such as CLDB and mfs) will keep
using the same directory after a pod restart.
Most logs for each pod name contain the same content as
/opt/mapr/logs because they are replaced with a symlink that
points to the logging directory created by each pod. Additional logs (ZooKeeper
transactions, collectd, grafana, etc.) are also
included here. A symlink is created whenever a pod starts or restarts. A sticky bit
ensures that this symlink behaves like a directory from an application
perspective.
Coredump Files
The coredump file uses the same logic as logging. A separate directory called
opt/cluster_cores is created and mounted to the user-specified
core-dump directory in the Data Fabric CR. All
core dumps corresponding to each pod follow the same hierarchy as logging. Here
again, symlinks replace the original core directory, and a catalog file is added
with an imageID where the specific image generates cores.
Spyglass Monitoring with Grafana
The Grafana dashboard allows you to monitor the following components:
- CPU
- Memory
- Network I/O
- Swap
- System Disk IOPS
- System Disk Throughput
CollectD pod's
FQDN. To visualize these metrics in the Grafana dashboard:
-
To find the node on which the grafana pod is running, execute the following command:
kubectl get pods -o wide -n <Cluster Name> | grep grafana grafana-7c8fcbb86f-58mj4 1/1 Running 0 40h 10.192.4.29 mip-bd-vm567.mip.storage.hpecorp.net <none> <none> - To get the port that Grafana is listening on, execute the following command:
kubectl get services -n <Cluster Name> | grep grafana grafana-svc NodePort 10.109.211.237 <none> 3000:30486/TCPNOTEThis will be typically in the 30000+ range. - Combine the node IP and port number from Step 1. and Step 2, and build the
Grafana dashboard URL:
https://<node-ip>:<port> - Launch a browser and navigate to the Grafana dashboard URL:
https://<node-ip>:<port> - Log in to the Grafana interface using the system username (default is
mapr) and password.NOTEYou can get the password using the following command:
wherekubectl get secret system -n <cluster-name> -o yaml | grep MAPR_PASSWORD | head -n 1 | awk '{ print $2 } 'dfis the name of the cluster. - Select to view the metrics.
The page displays the node resources used by components across pods in the Kubernetes environment.
Kibana Monitoring
The default Kibana username is: admin
The default password can be obtained from system secret in the Data Fabric namespace. For example, if the name of the
Data Fabric cluster is df,
the command to get the password is the following:
kubectl -n df get secret system -o jsonpath="{$.data.MAPR_PASSWORD}" | base64 -dManaging Storage Pools and File System Instances
The HPE Ezmeral Data Fabric on Kubernetes supports storage pools and multiple
instances of the file system. These features are implemented through the
storagepoolsize and storagepoolsperinstance
parameters for the diskinfo object in the Data Fabric CR.
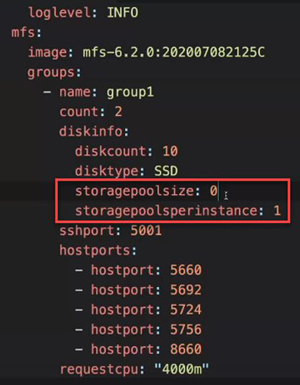
storagepoolsize- You can use storage pools to group disks and can control the number of disks in a storage pool by adjusting thestoragepoolsizevalue. Eachmfsgroup can have a different storage pool size. A storage pool can have up to 32 drives.storagepoolsperinstance- integer - Number of storage pools that an instance of the file system will manage. The platform launches multiple instances of the file system based on the specified number of storage pools. The default value is0, which sets the number of storage pools based on internal algorithms. A value greater than32generates an error.
Most installations benefit from having both of these parameters set to 0; however,
some advanced situations may call for different settings. See diskinfo in MFS Core Object.