Dashboard - Kubernetes Cluster Administrator
Users who are logged into a Kubernetes tenant with the Cluster Administrator role can access the Kubernetes Cluster Administrator Dashboard screen by selecting Dashboard in the main menu.
The top of this screen has three buttons that allows you to download the plugins that you need to access Kubernetes pods within a cluster. The buttons are:
- Download HPE Kubectl Plugin: Downloads the HPE installer for the
kubectlcommand line tool for controlling a Kubernetes cluster. For more information about kubectl, see Command line tool (kubectl) (link opens an external website in a new browser tab/window). You will need to install this application. See Installing Kubectl, and Using the HPE Kubectl Plugin. - Download Kubectl: Downloads the generic installer for the
kubectlcommand line tool for managing a Kubernetes cluster. Please click here for more information (link opens an external website in a new browser tab/window). You will need to install this application. See Installing Kubectl.
kubectl-hpecp cannot be
opened because the publisher cannot be verified. You can safely ignore this warning and
proceed with the installation. - Download Kubeconfig: Downloads the
kubeconfigfile that contains information to configure access to Kubernetes when used in conjunction with either thekubectlcommand line tool or other clients. For more information about thekubeconfigfile, see Organizing Cluster Access Using kubeconfig Files (link opens an external website in a new browser tab/window).
This screen has the following tabs:
- Usage
-
Displays resource usage on a cluster-wide and tenant-by-tenant basis. See Usage Tab.
- Monitoring
-
Provides detailed resource monitoring. See Monitoring Tab.
Usage Tab
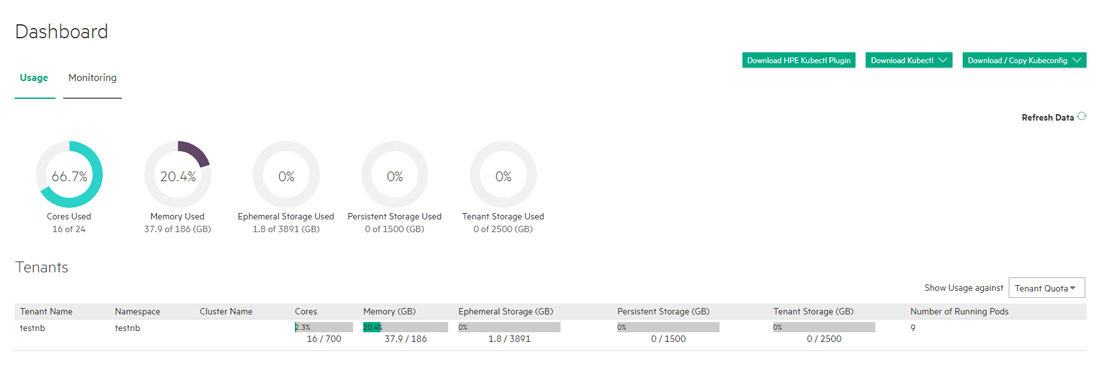
The Usage tab displays usage statistics for the current Kubernetes cluster.

The top of the Usage tab displays dials showing the following aggregate information for the cur:
- Cores Used: Percentage of available virtual CPU cores being used by all of the tenants in the deployment.
- Memory Used (GB): Percentage of available RAM being used by all of the tenants in the deployment.
- Ephemeral Storage Used (GB): Percentage of available ephemeral storage used and the total available persistent storage, in GB.
- Persistent Storage Used (GB): Percentage of available persistent storage used and the total available persistent storage, in GB.
- Tenant Storage Used (GB): Percentage of available tenant storage used and the total available persistent storage, in GB.
-
GPU Utilization (percent): If GPUs are present, displays aggregate GPU utilization in percent.
-
GPU Memory Usage: If GPUs are present, displays aggregate GPU memory usage in percent.
The bottom of this tab contains a table that lists all of the tenants within the current Kubernetes cluster. This table displays the Tenant Name, Namespace, Cluster Name, Cores, Memory (GB), Ephemeral Storage, Persistent Storage, Tenant Storage, and the Number of Running Pods. This data can be expressed against either the Tenant Quota or total System Resources, depending on your Show Usage against menu selection.
Monitoring Tab
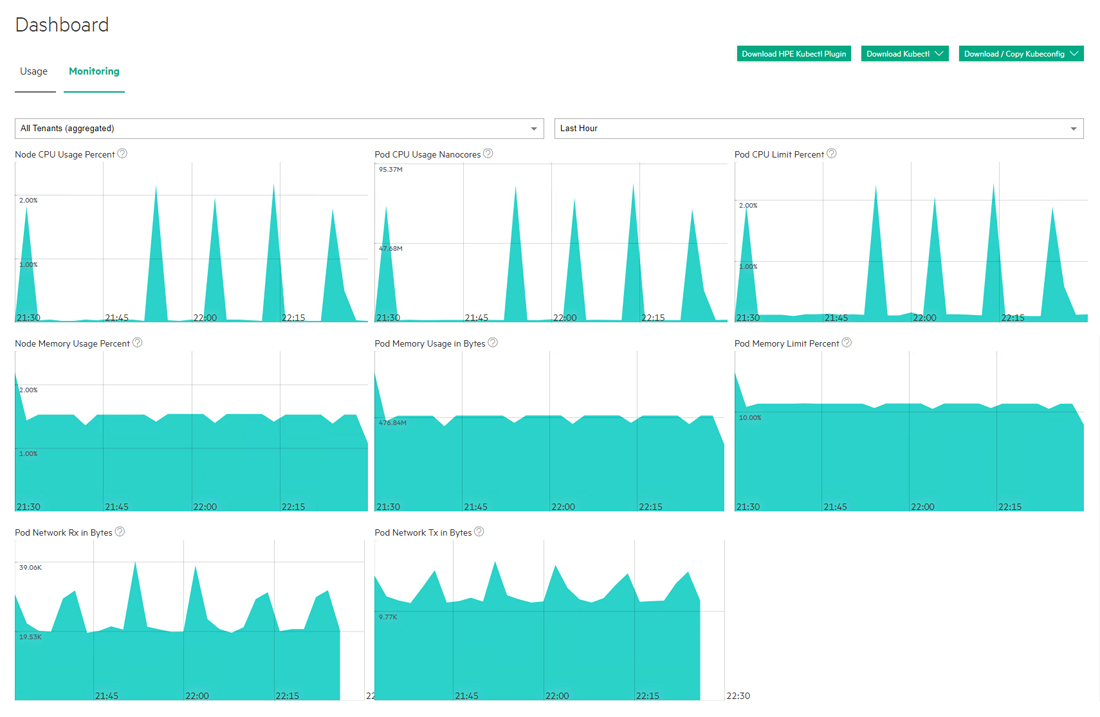
The Monitoring tab displays resource usage over time.

The top of this screen has three buttons that allows you to download the plugins that you need to access Kubernetes pods within a cluster. The buttons are:
- Download HPE Kubectl Plugin: Downloads the HPE installer for the
kubectlcommand line tool for controlling a Kubernetes cluster. Please click here for more information (link opens an external website in a new browser tab/window). You will need to install this application. See Installing Kubectl, below. - Download Kubectl: Downloads the generic installer for the
kubectlcommand line tool for controlling a Kubernetes cluster. Please click here for more information (link opens an external website in a new browser tab/window). You will need to install this application. See Installing Kubectl, below. - Download Kubeconfig: Downloads the
kubeconfigfile that configures access to Kubernetes when used in conjunction with either thekubectlcommand line tool or other clients. Please click here for more information (link opens an external website in a new browser tab/window).
The top of this screen has three pull-down menus that allow you to filter the data by tenant, pod, and time frame. You may also choose to view information for all applications or only for KubeDirector applications by moving the Filter KubeDirector Applications slider. Hovering your mouse over the graphs displays a popup with additional information. The following charts are available:
- Node CPU Usage Percent: Percentage of available CPU resources in use.
- Pod CPU Use Nanocores: Number of CPU nanocores in use.
- Pod CPU Pod Limit Percent: Percentage of maximum number of pods that are currently running inside the current cluster.
- Node Memory Usage Percent: Percentage of available memory being used.
- Pod Memory Usage in Bytes: Bytes of memory being used.
- Pod Memory Limit Percent: Percentage of memory limit being used.
- Pod Network Rx in Bytes: Bytes received over the network.
- Pod Network Tx in Bytes: Bytes transmitted over the network.
Installing Kubectl
To install Kubectl on your local system:
- Download both of the Kubectl plugins by clicking the HPE Kubectl
Plugin and Kubectl buttons:
- If you are on a Windows system, then these downloads will be .exe files.
-
If you are on a MacOS or UNIX system, then you will need to execute the following commands:
chmod +x kubectl-hpecpchmod +x kubectl
- Place both executables into a folder that is on your system's PATH. You can find
the folders in your system's PATH by executing the appropriate command:
- Windows:
ECHO %PATH% - MacOS or Linux:
echo $PATH
- Windows:
- Execute the command
kubectl hpecp refresh {HPE Ezmeral Runtime Enterprise
                        controller/gateway ip address}
. If HTTPS is not enabled, then add the argument--insecure=true.