BI Reporting (Superset) Basics
Provides basic steps for using the BI Reporting (Superset) space within HPE Ezmeral Unified Analytics Software.
You can add data sets that you created in HPE Ezmeral Unified Analytics Software to Superset and visualize the data in dashboards. You can access dashboards (Superset) from the BI Reporting space within HPE Ezmeral Unified Analytics Software.
Tutorial Objective
- Add datasets created in HPE Ezmeral Unified Analytics Software to Superset
- Visualize the data set in a chart
- Create a dashboard
- Add the chart to the dashboard
This tutorial takes approximately 10 minutes to complete.
You may want to print the following instructions or open the instructions on a different monitor to avoid switching between HPE Ezmeral Unified Analytics Software and the tutorial on one monitor.Prerequisite
This tutorial builds on Data Source Connectivity and Exploration.
In the Data Source Connectivity and Exploration tutorial, you created a view (customer_info_view) and a schema (customer_schema) from a query that joined customer tables from two different data sources (MySQL and Snowflake). In this tutorial, you import the view and schema into Superset, visualize the data in a chart, and add the chart to a dashboard.A – Sign in to HPE Ezmeral Unified Analytics Software
Sign in to HPE Ezmeral Unified Analytics Software with the URL provided by your administrator.
B - Connect to the Presto Database
Complete the following steps to connect Superset to the Presto database for access to your data sources and data sets in HPE Ezmeral Unified Analytics Software. Once connected to the Presto database, you can access your data sets in HPE Ezmeral Unified Analytics Software from Superset.
presto://<presto.domain.name>:443/<catalogname>- To open Superset, in the left navigation pane of HPE Ezmeral Unified Analytics Software, select BI Reporting > Dashboards. Superset opens in a new tab.
- In Superset, select Settings > Database Connections.
- Click +DATABASE.
- In the Connect a database window, select the Presto tile.
- Enter the SQLALCHEMY URI provided by your administrator.
- Test the connection.
- If the test was successful, click Connect.
C – Add a Data Set to a Chart
- Select the Datasets tab.
- Click + DATASET.
- In the Add dataset window, make the following selections in the fields:
- DATABASE: Presto
- SCHEMA: <your_schema>
- SEE TABLE SCHEMA: <your_view>
- Click ADD DATASET AND CREATE CHART.
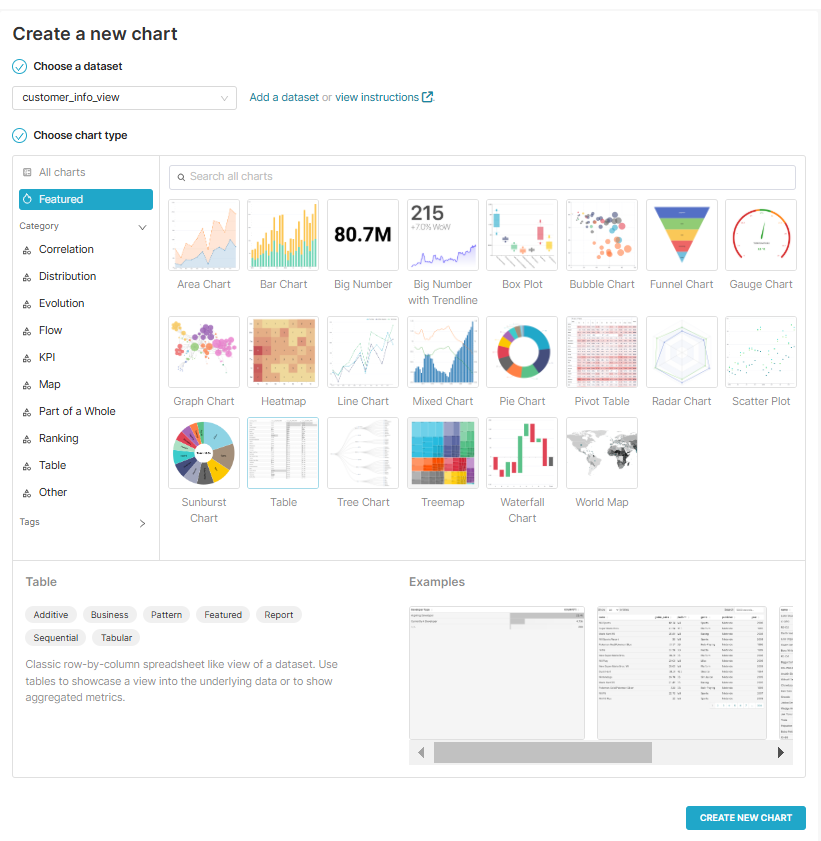
- In Choose chart type column, select Featured and choose Table.
- Click CREATE NEW
CHART.
- In the chart screen, enter a name for the chart. For example, name the chart Customer Info.
- Select RAW RECORDS as the QUERY MODE.
- Drag and drop the following four columns into the COLUMNS field:
- c_customer_id
- c_first_name
- c_last_name
- c_email_address
- Click into the Filters field and select or enter the following information in
the window that opens:
- c_first_name
- Equal to (=)
- Charles
- Click SAVE.
- Click CREATE CHART. The query runs and results that meet the query conditions display. The chart displays four columns of data for customers with the first name Charles.
- Click SAVE to save the chart. A window opens. Click SAVE in the window.
Do not add to a dashboard. Superset saves the chart.

D – Create a Dashboard and Add the Chart
- In Superset, click the Dashboards tab.
- Click +DASHBOARD.
- Enter a name (title) for the dashboard, for example Customer Dashboard.
- In the right navigation bar, click the LAYOUT ELEMENTS tab.
- Drag and drop the Header element into the dashboard.
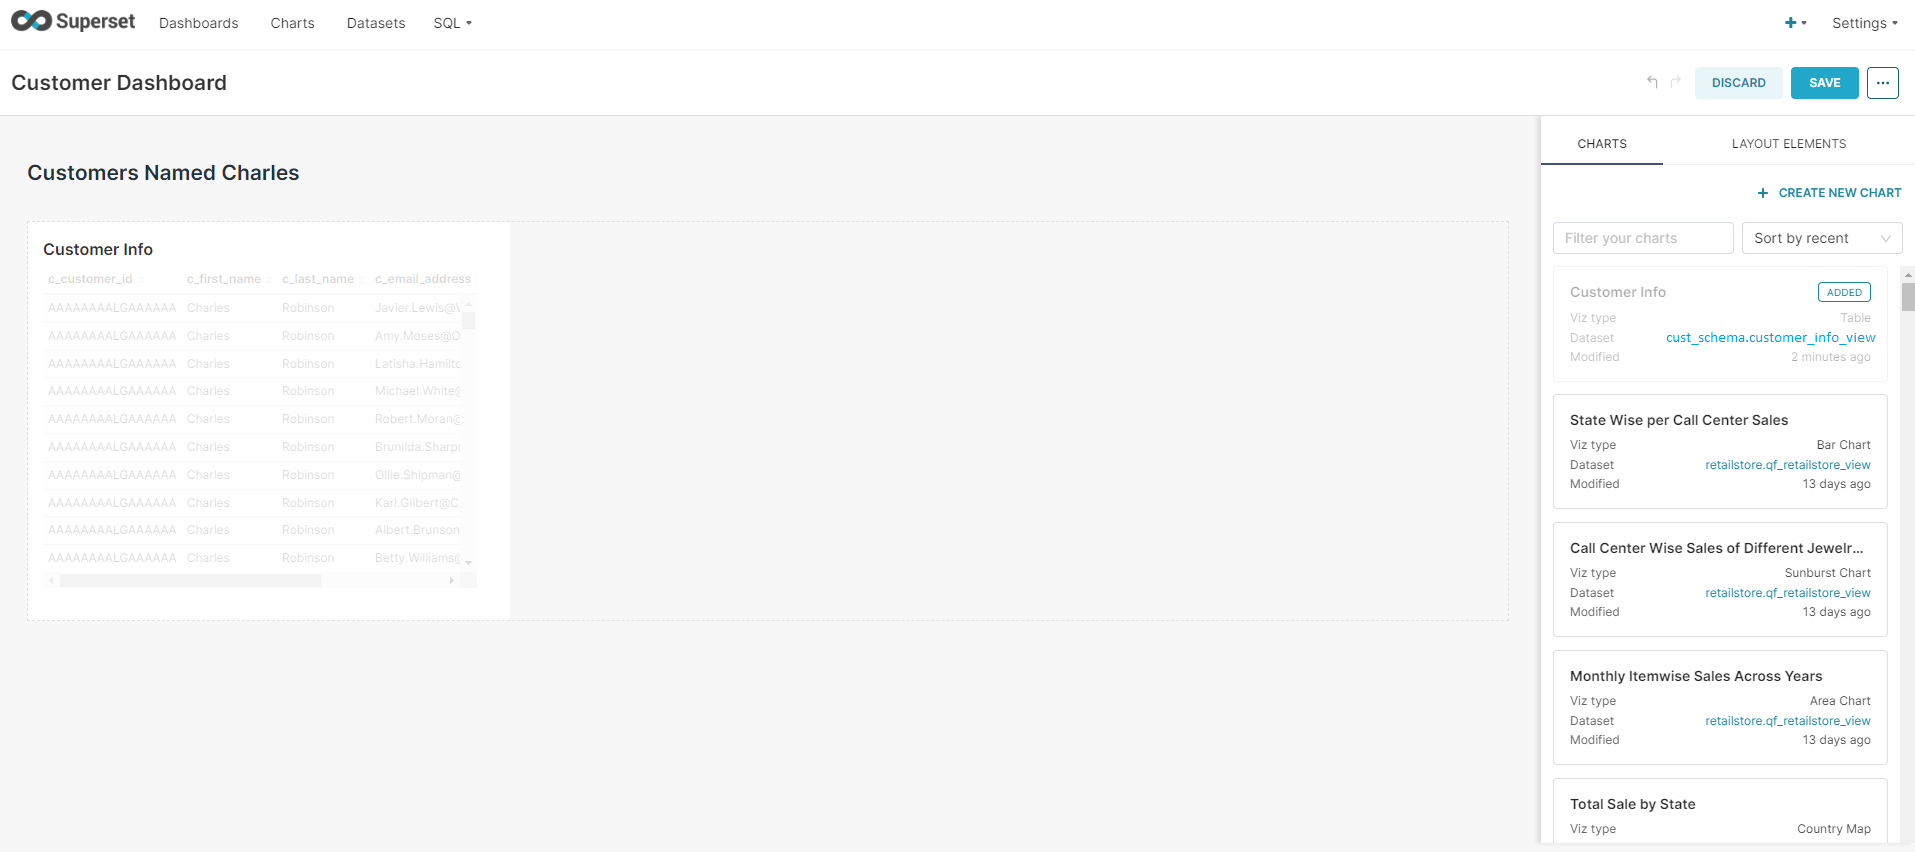
- In the Header element, enter a title, for example Customers Named Charles.
- In the right navigation bar, click the CHARTS tab.
- Locate the chart you created (Customer Info) and drag and drop the chart into the dashboard. You may need to drag the chart over the Header title and drop it there to get it to stay in place. A blue line appears in the dashboard when the chart is in a place it can be dropped.
- Click SAVE to save the dashboard.
End of Tutorial
You have completed this tutorial. This tutorial demonstrated the integration of the HPE Ezmeral Unified Analytics Software SQL query engine (EzPresto) with Superset to visualize data models that you create in the Data Engineering space using the charting and dashboarding features in Superset.
You may also be interested in the Retail Store Analysis Dashboard (Superset), which shows you how to create a database connection, visualize data, and monitor queries used in visualizations.