Financial Time Series Workflow
Describes how to use HPE Ezmeral Unified Analytics Software to run a Spark application from an Airflow DAG and then run a Jupyter notebook to analyze and visualize data that the Spark application puts into a shared directory in the shared volume that the data scientist’s notebook is mounted to.
Scenario
A DAG source (located in GitHub) is coded to submit a Spark job that pulls CSV data
(financial.csv) from an S3 data source, transforms the data into Parquet
format, and puts the data in a shared volume in the financial-processed
folder.

Steps
Sign in to HPE Ezmeral Unified Analytics Software and perform the following steps:
Prerequisites
<username> folder with a sample notebook file and SSL
certificate is provided for the purpose of this tutorial. To connect your notebook and
perform setup tasks, follow these steps:An administrator must create an S3 object store bucket and load data. The Spark application reads raw data from the local-S3 Object Store.
ezaf-demo bucket at
data/,
run:# Code to copy finacial.csv from ezua-tutorials to ezaf-demo bucket at data/ for Financial Time Series Example
import boto3
s3 = boto3.client("s3", verify=False)
bucket = 'ezaf-demo'
source_file = '/mnt/shared/ezua-tutorials/current-release/Data-Science/Kubeflow/Financial-Time-Series/dataset/financial.csv'
dest_object = 'data/financial.csv'
# Check whether bucket is already created
buckets = s3.list_buckets()
bucket_exists = False
available_buckets = buckets["Buckets"]
for available_bucket in available_buckets:
if available_bucket["Name"] == bucket:
bucket_exists = True
break
# Create bucket if not exists
if not bucket_exists:
s3.create_bucket(Bucket=bucket)
# Upload file
s3.upload_file(Filename=source_file, Bucket=bucket, Key=dest_object) Before completing these steps as a member user, ask the administrator to complete the steps for administrator users.
- In the HPE Ezmeral Unified Analytics Software, go to Tools & Frameworks.
- Select the Data Science tab and then click Open in the Kubeflow tile.
- In Kubeflow, click Notebooks to open the notebooks page.
- Click Connect to connect to your notebook server.
- Go to the
/<username>folder. - Copy the template
object_store_secret.yaml.tplfile from theshared/ezua-tutorials/current-release/Data-Analytics/Sparkdirectory to the/mnt/userfolder. - In the
<username>/Financial-Time-Seriesfolder, open thefinancial_time_series_example.ipynbfile.NOTEIf you do not see theFinancial-Time-Seriesfolder in the<username>folder, copy the folder from theshared/ezua-tutorials/current-release/Data-Science/Kubeflowdirectory into the<username>folder. Theshareddirectory is accessible to all users. Editing or running examples from theshareddirectory is not advised. The<username>directory is specific to you and cannot be accessed by other users.If the
Financial-Time-Seriesfolder is not available in theshared/ezua-tutorials/current-release/Data-Science/Kubeflowdirectory, perform:- Go to GitHub repository for tutorials.
- Clone the repository.
- Navigate to
ezua-tutorials/Data-Science/Kubeflow. - Navigate back to the
<username>directory. - Copy the
Financial-Time-Seriesfolder from theezua-tutorials/Data-Science/Kubeflowdirectory into the<username>directory.
- To generate a secret to read data source files from S3 bucket by Spark
application (Airflow DAG), run the first cell of the
financial_time_series_example.ipynbfile:import kfp kfp_client = kfp.Client() namespace = kfp_client.get_user_namespace() !sed -e "s/\$AUTH_TOKEN/$AUTH_TOKEN/" /mnt/user/object_store_secret.yaml.tpl > object_store_secret.yaml
A - Run a DAG in Airflow
spark_read_csv_write_parquet_fts. The DAG
runs a Spark application that reads CSV data (financial.csv) from an S3
bucket, transforms the data into Parquet format, and writes the transformed Parquet data
into the shared volume.- Run the DAG
-
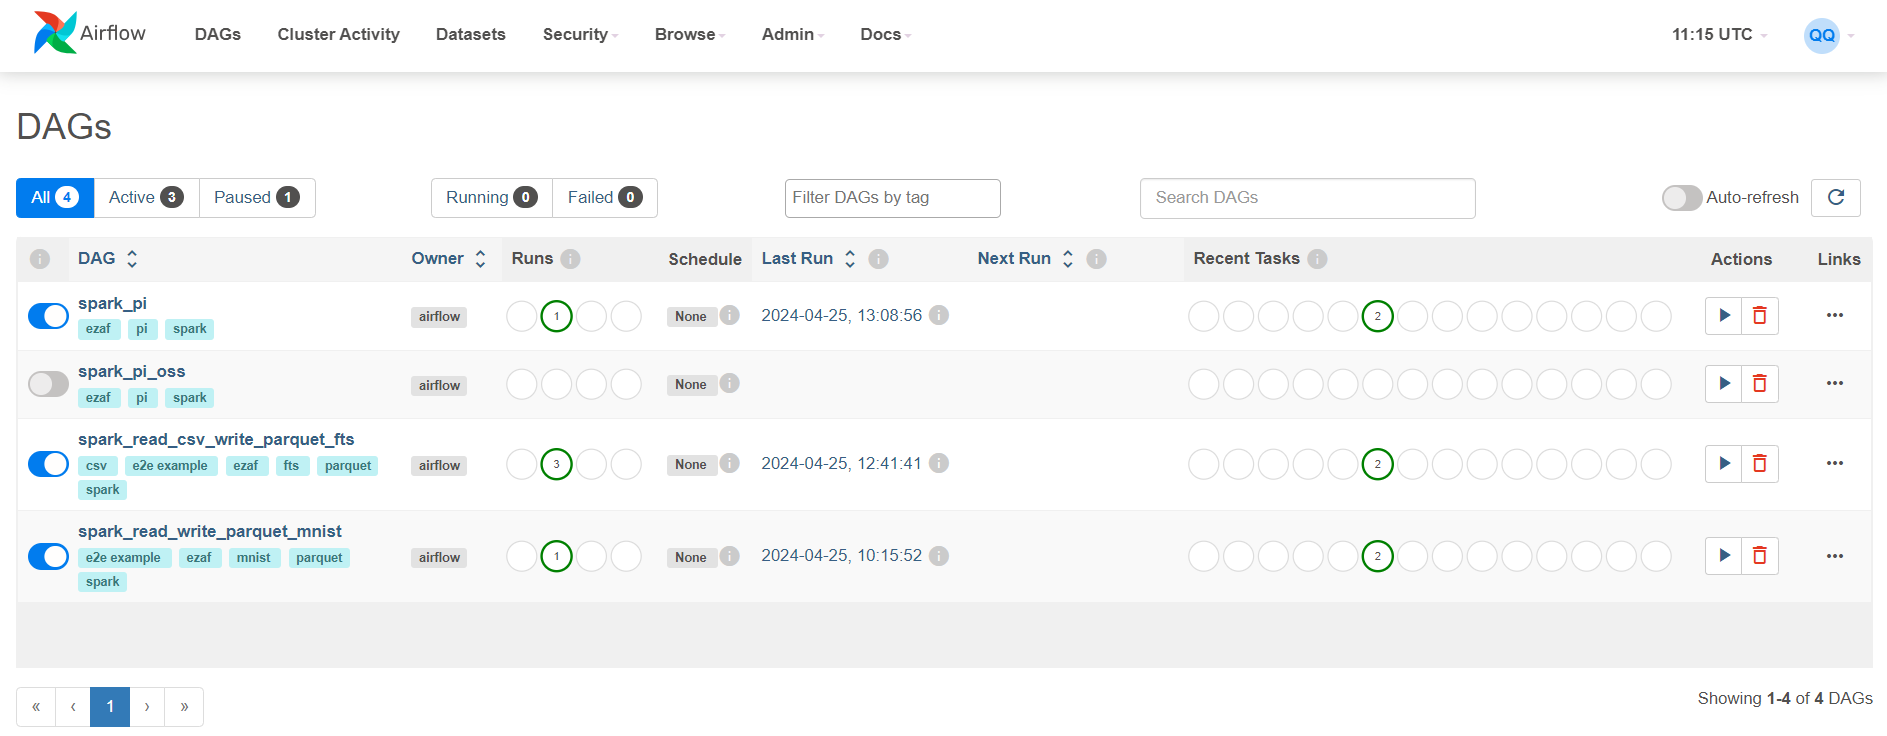
- Navigate to the Airflow screen using either of the following methods:
- Click Data Engineering > Airflow Pipelines.
- Click Tools & Frameworks, select the Data Engineering tab, and click Open in the Airflow tile.
- In Airflow, verify that you are on the DAGs screen.
- Click
spark_read_csv_write_parquet_ftsDAG. NOTEThe DAG is pulled from a pre-configured HPE GitHub repository. This DAG is constructed to submit a Spark application that pulls
financial.csvfile into Parquet format, and places the converted files in a shared directory. If you want to use your private GitHub repository, see Airflow DAGs Git Repository to learn how to configure your repository. - Click Code to view the DAG code.
- Click Graph to view the graphical representation of the DAG.
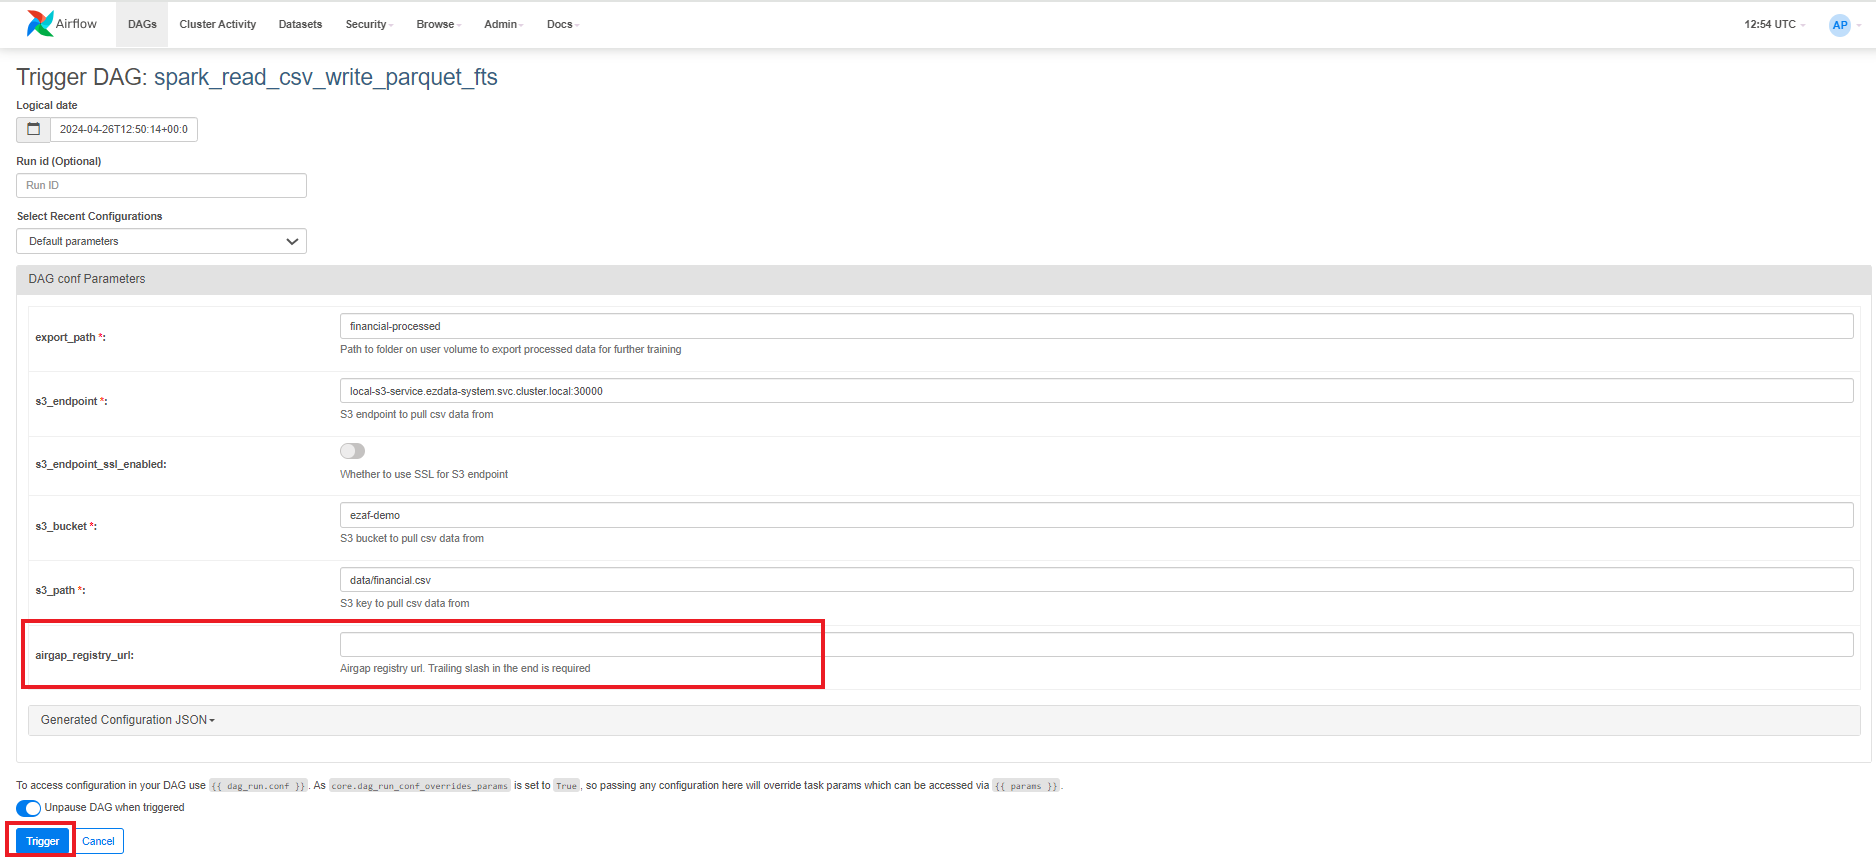
- Click Trigger DAG (play button) to open a screen where you can configure
parameters.

- (Air-gapped environment only) Specify the airgap registry URL.
- Click the Trigger button located at the bottom-left of
the screen.Upon successful DAG completion, the data is accessible inside your notebook server in the following directory for further processing:
shared/financial-processed" - To view details for the DAG, click Details. Under
DAG Details, you can see green, red, and/or yellow
buttons with the number of times the DAG ran successfully or failed.
- Click the Success button.
- To find your job, sort by End Date to see the latest jobs that have run,
and then scroll to the right and click the log icon under Log URL for that run.
Note that jobs run with the
configuration:
Conf "username":"your_username"When running Spark applications using Airflow, you can see the following logs:Reading from s3a://ezaf-demo/data/financial.csv; src format is csv 22/11/04 11:53:26 WARN AmazonHttpClient: SSL Certificate checking for endpoints has been explicitly disabled. Read complete Writing to file:///mounts/data/financial-processed; dest format is parquet Write completeIMPORTANTThe cluster clears the logs that result from the DAG runs. The duration after which the cluster clears the logs depends on the Airflow task, cluster configuration, and policy.
- Navigate to the Airflow screen using either of the following methods:
B – View the Spark Application
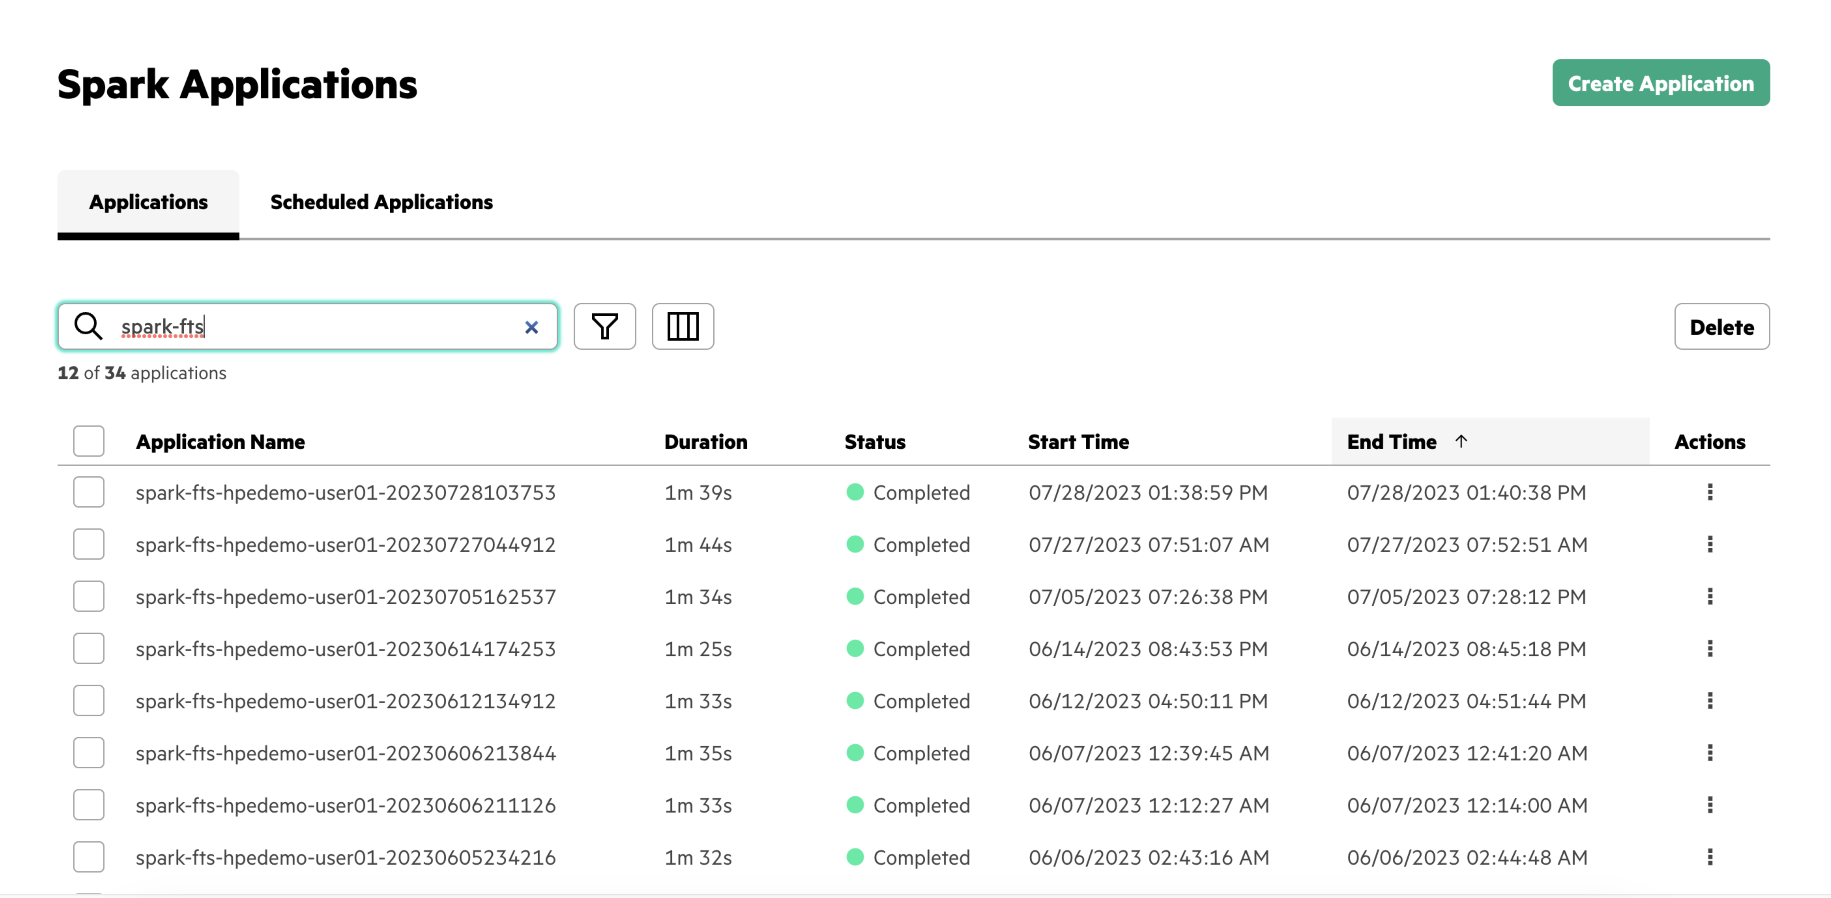
Once you have triggered the DAG, you can view the Spark application in the Spark Applications screen.
To view the Spark application, go to Analytics > Spark Applications from the left navigation bar.
Alternatively, you can go to Tools & Frameworks and then click
on the Analytics tab. On the Analytics tab,
select the Spark Operator tile and click
Open.
C – Run the Jupyter Notebook
Run the Jupyter notebook file to analyze and visualize the financial time series data.
To run the notebook:- Connect to the notebook server. See Creating and Managing Notebook Servers.
- In the Notebooks screen, navigate to the
shared/financial-processed/folder to validate that the data processed by the Spark application is available. - In the
<username>/Financial-Time-Series/folder, open thefinancial_time_series_example.ipynbfile. -
In the sixth cell of the
financial_time_series_example.ipynbfile, update the user folder name as follows:user_mounted_dir_name = "<username-folder-name>"
- In the Notebook Launcher, select the second cell of the notebook and click Run the selected cells and advance (play icon).
- After the packages install, restart the notebook kernel. To restart the kernel, click the Restart the kernel button or select Kernel > Restart Kernel in the menu bar at the top of the screen.
- After the kernel restarts, click into the second cell and select Run the selected cells and All Below.
- Review the results of each notebook cell to analyze and visualize the data.
End of Tutorial
You have completed this tutorial. This tutorial demonstrated that you can use Airflow, Spark, and Notebooks in Unified Analytics to extract, transform, and load data into a shared volume and then run analytics and visualize the transformed data.