Viewing Kubernetes Cluster Details
Clicking a cluster name in the Kubernetes Clusters screen opens the Cluster Details screen for that cluster. This screen has the following tabs:
- Host(s) Info: Displays information about the hosts in the Kubernetes cluster. See Host(s) Info Tab.
- Load Tab: Displays resource usage information for the current Kubernetes cluster. See Load Tab.
- Services Status: This tab displays the status of various Kubernetes cluster services. See Services Status Tab.
- Alerts: Warnings or errors that affect the current Kubernetes cluster appear here. See Alerts Tab.
Host(s) Info Tab
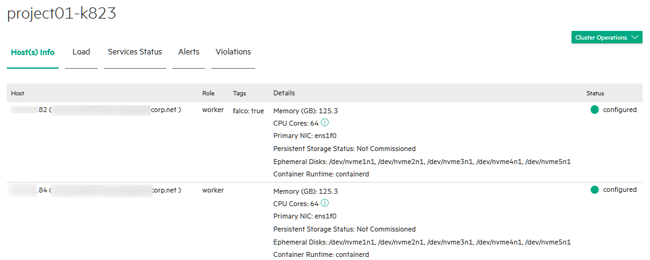
The Host(s) Info tab of the Cluster Details screen appears as shown in the following image.
This tab contains the following button:
- Cluster Operations: Clicking this button opens a menu
with the following options:
- Delete Cluster: Deletes this Kubernetes cluster. See Deleting a Kubernetes Cluster.
- Edit Cluster: Allows you to edit the current Kubernetes cluster. See Editing an Existing Kubernetes Cluster.
- Access Kubernetes Dashboard: Launches the Kubernetes dashboard. See Accessing the Kubernetes Dashboard.
- Download Admin Kubeconfig: Downloads the administrator Kubeconfig file for the cluster. See Downloading Admin Kubeconfig.
- If this is a HPE Ezmeral Data Fabric on Kubernetes cluster,
the following items are also displayed:
- Grafana Endpoint
- Kibana Endpoint
- Data Fabric Managed Control System
The Host List table on this tab displays the following information for each of the hosts in the selected cluster:
- Name: Name of the host.
- Role: Role of the host, such as Master (master) or Worker (worker). If custom roles are defined for this cluster, those will appear here as well.
- Tags: The tags that have been assigned
to the host. For example, HPE Ezmeral Data Fabric hosts have the tag:
Datafabric: Yes - Details:
Lists information about the host, such as the CPU cores,
number of GPU devices, RAM, primary NIC, persistent storage status, the
paths to the ephemeral and persistent storage, and the container
runtime.
If the host is running the Hewlett Packard Enterprise distribution of Kubernetes, the container runtime is
containerd. If the host is part of a Kubernetes cluster that was created on a previous version of HPE Ezmeral Runtime Enterprise and has not been migrated to use the Hewlett Packard Enterprise distribution of Kubernetes, the container runtime isDocker.If the GPU supports MIG, when you click the More Info link, GPU Details dialog shows information about the MIG configuration. For example:
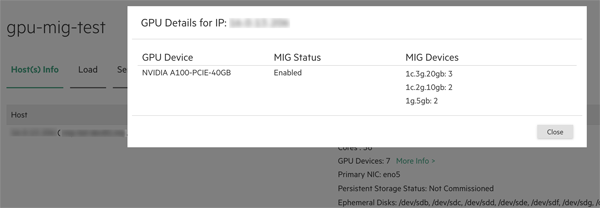
If the GPU device does not support MIG, the GPU Details dialog lists the GPU devices, but shows
N/Ain MIG Status and in MIG Devices. - Status: Status of the host.
Load Tab
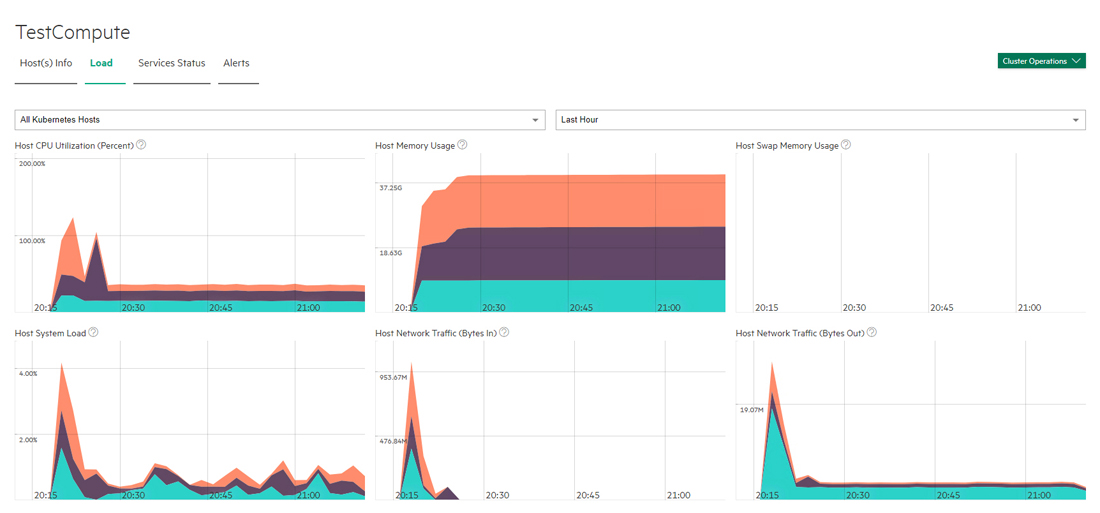
The Load tab displays a series of dials and charts. Hovering the mouse over a bar opens a popup with more detailed information for the selected time.
This tab contains the following buttons:
-
This tab shows the following information for the selected time period:
- Host CPU Utilization Percent: The chart indicates the current percentage of host CPU utilization across all cluster processes that are currently running for the selected host(s) over the selected time period.
- Host Memory Usage: The chart indicates the current use of host memory across all cluster processes for the selected host(s) over the selected time period.
- Host Swap Memory Usage: The chart indicates the amount of swap-file usage over the selected time period, in GB, for the selected host(s) over the selected time period.
- Host System Load: The graph shows the average percentage of host CPU cores used by the Kubernetes tenants (defined as the number of CPU cores in use vs. the total number of available CPU cores) for the selected host(s) over the selected time period.
- Host Network Traffic (Bytes In): The dial indicates the amount of incoming host network bandwidth being used by the selected host(s) over the selected time period.
- Host Network Traffic (Bytes Out): The dial indicates the amount of outgoing host network bandwidth being used by the selected host(s) over the selected time period.
The following additional information applies to Kubernetes clusters with GPUs enabled:
- GPU Utilization (percent): Selecting All hosts in the left pull-down menu displays aggregate GPU utilization in percent per host. Selecting an individual host displays per-GPU utilization for that host.
- GPU Memory Usage: Selecting All hosts in the left pull-down menu displays aggregate GPU memory usage in percent per host. Selecting an individual host displays per-GPU memory usage for that host.
You may select the host(s) you want to view and also adjust the time period for which results appear using the pull-down menus at the right side of the Load tab. The available options are:
- Last Hour (default)
- 6 Hours
- Day
- Week
Services Status Tab
The Services Status tab of the Kubernetes Cluster Details screen appears as shown in the following image.
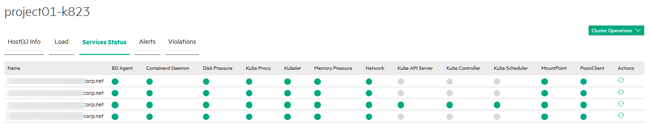
The information on this tab varies depending on the type of cluster. Hosts that are part of HPE Ezmeral Data Fabric on Kubernetes or Embedded Data Fabric deployment includes information about services related to the Data Fabric. This tab displays information such as (but not necessarily limited to) the following for each host in the deployment:
- Host Name:Name of the host.
- BD Agent: Status of the management service, which handles back-end administration tasks.
- Monitoring Collector: Status of the monitoring engine that collects performance, usage, and other metrics.
- Disk Pressure: Whether the available disk space and inodes on either the node's root filesystem or image filesystem has satisfied an eviction threshold.
- Containerd Daemon: Status of the containerd daemon, which creates and manages Kubernetes containers.
- Kube API Server: Status of the Kubernetes API server.
- Kube Controller: Status of the Kubernetes controller host.
- Kube Proxy: Status of the Kubernetes proxy.
- Kube Scheduler: Status of the control plane Kubernetes scheduler.
- Kubelet: Maintains the pods that are running inside each host.
- Memory Pressure: Whether the available host memory has satisfied an eviction threshold.
- Network: Kubernetes network status.
- FileServer: File server status of the integrated persistent storage.
- MountPoint: Mount point status of the integrated persistent storage.
- PosixClient: Status of the POSIX Client of the integrated persistent storage.
- Warden: Warden status.
The status of a service can be either OK (green dot), CRITICAL (red dot), or DISABLED (intentionally not running; gray dot). Hovering the mouse over the status button opens a popup with additional information. In general:
- The Master host must not display any red dots. If the Master host has one or more error(s), then the Kubernetes cluster may not function properly.
- If all of the dots for a Worker host are red, then that host will not be able to provide resources to the cluster. This situation typically occurs because the host has been powered off, has lost network connectivity, or because HPE Ezmeral Runtime Enterprise is not properly installed.
- A Worker host with some red and some green dots may cause some Kubernetes cluster operations to fail, unless the errors are transient conditions caused by the host powering on or regaining network connectivity.
Please generate a support bundle and then contact Hewlett Packard Enterprise Technical Support if a host that is reporting service errors meets all of the following criteria:
- HPE Ezmeral Runtime Enterprise is completely installed.
- The host is powered on.
- The host has network connectivity.
See The Support/Troubleshooting Screen and Generating a Support Bundle.
Alerts Tab
The Alerts tab displays any alert messages from the Caching Node, Data Server, and Management services.
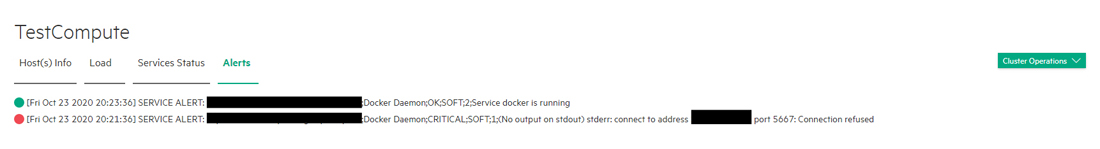
The following alerts appear in this tab:
- Notifications: Routine messages. A green dot appears next to each routine notification.
- Error: A minor error has occurred. A gray dot appears next to each error notification.
- Warning: A serious error has occurred. An orange dot appears next to each warning notification.
- Critical: A critical error has occurred. A red dot appears next to each critical notification.
See Troubleshooting Overview for assistance diagnosing and resolving errors.